


7 Statistics about Voting and Voter Turnout in New York City’s 2017 Elections
05/02/2018
The newly released 2018-2017 VAAC Report takes a look voter registration and turnout data in New York City during the 2017 election cycle. We’ve pulled out several charts and maps from the report that illustrate several key findings included. See the full report here for more details.
1) New Voter Registrations by Month in 2017 in New York City
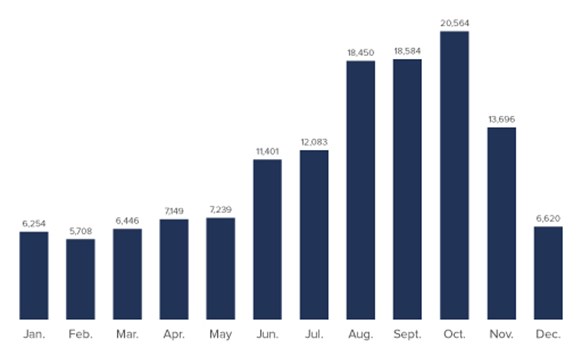
New York City added 134,194 new voters in 2017. Now there are more than 4.6 million active registered voters in the city—more than ever before!
2) Voter Turnout among Citizens of Voting Age by Election Year in New York City
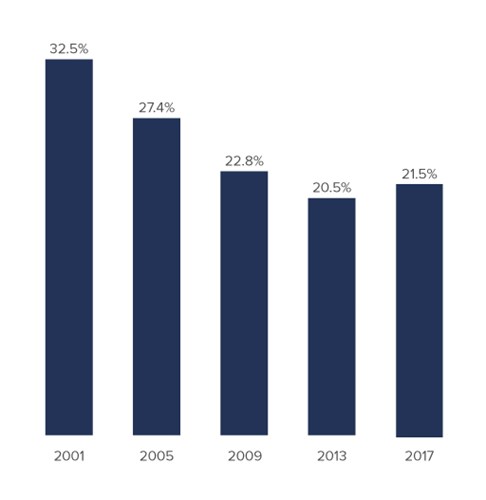
Over 60,000 more voters cast a ballot in 2017 than in 2013. That’s the good news. But voter turnout as a percentage of eligible voters did not increase by much at all. However, this was still the first municipal election since 2001 when the number of voters went up compared to the previous city election.
3) Top 25 Neighborhoods for New Voter Registrations in New York City
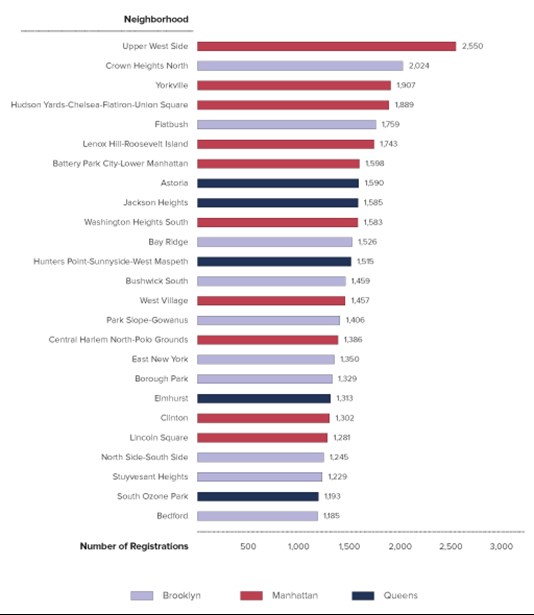
Every single New York City neighborhood saw an increase in registered voters in 2017, some adding thousands of voters. Here are the top 25 neighborhoods for new voter registrations in 2017.
4) Bottom 25 Neighborhoods for Voter Registration in New York City
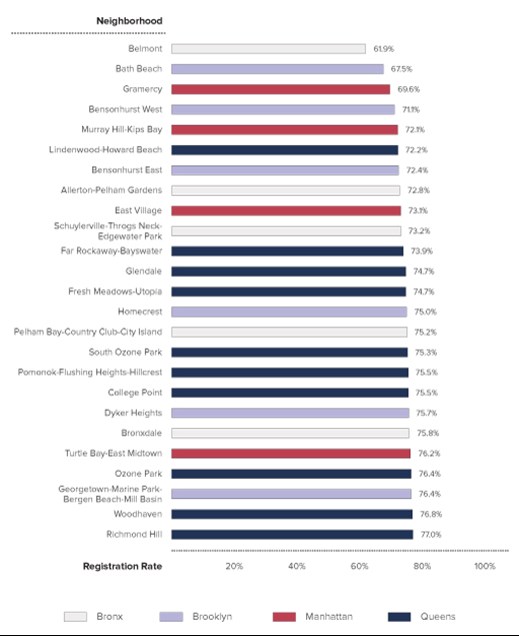
Here are the neighborhoods where voter registration remains low, and where NYC Votes and our partner organizations will have the most work cut out for our registration efforts in the years ahead.
Want to help? Sign up for our emails to stay in touch with NYC Votes and learn about volunteer opportunities.
5) Number of Voter Registrations by Age Group as of November 7, 2017 in New York City
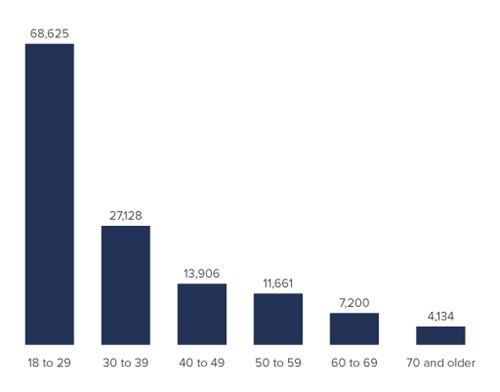
Over half (51.1%) of newly registered voters in 2017 were under the age of 30. However, only 13.4% of registered voters under 30 cast a ballot in 2017. We need to do more to get young people to the polls.
6) 2017 New York City Primary Election Turnout by Borough
(From the Tableau Maps on the Website)
Turnout in the 2017 primary elections was at its highest in Manhattan. How does your borough stack up against the others in this map?
7) 2017 New York City General Election Turnout by Borough
(From the Tableau Maps on the Website)
For the general election, turnout was highest in Staten Island. Share this map on social media to highlight how your community is voting.